Report Management
visionBoard has the capability of generating reports that can be used to analyze data.
How to Generate Reports
You can generate the reports by running the workflow generate-reports. This will generate the HTML and JSON directly in the output folder. Any time that you want to refresh the reports, you need to re-run the command as the information generated is purely static.
You can also use this command to generate the files and relocate them to another server if you want to make this information public. The JSON files are not consumed by the HTML files, so you can include them or not in the new location.
Showcase the Reports
The simplest option is to run the workflow show-reports, which will start an HTTP server that lists the content in the output folder. Any asset previously generated can be accessed via a web browser using this approach.
Static Server
visionBoard includes the option to run a local HTTP server to serve the artifacts generated during its processes. This allows easy access to outputs without needing external hosting.
You can customize the server by defining the following environment variables:
IP: The IP address the server should bind to (default:localhost).PORT: The port the server should use (default:3000).
For example, to run the server on a specific IP and port:
export IP=192.168.1.100
export PORT=8080
visionBoard workflow run --name show-reports
If these variables are not set, visionBoard will default to localhost:3000.
Screenshots
This is how the reports look using the seed data from the database.
General report
This is the /output/index.html file rendered in the browser
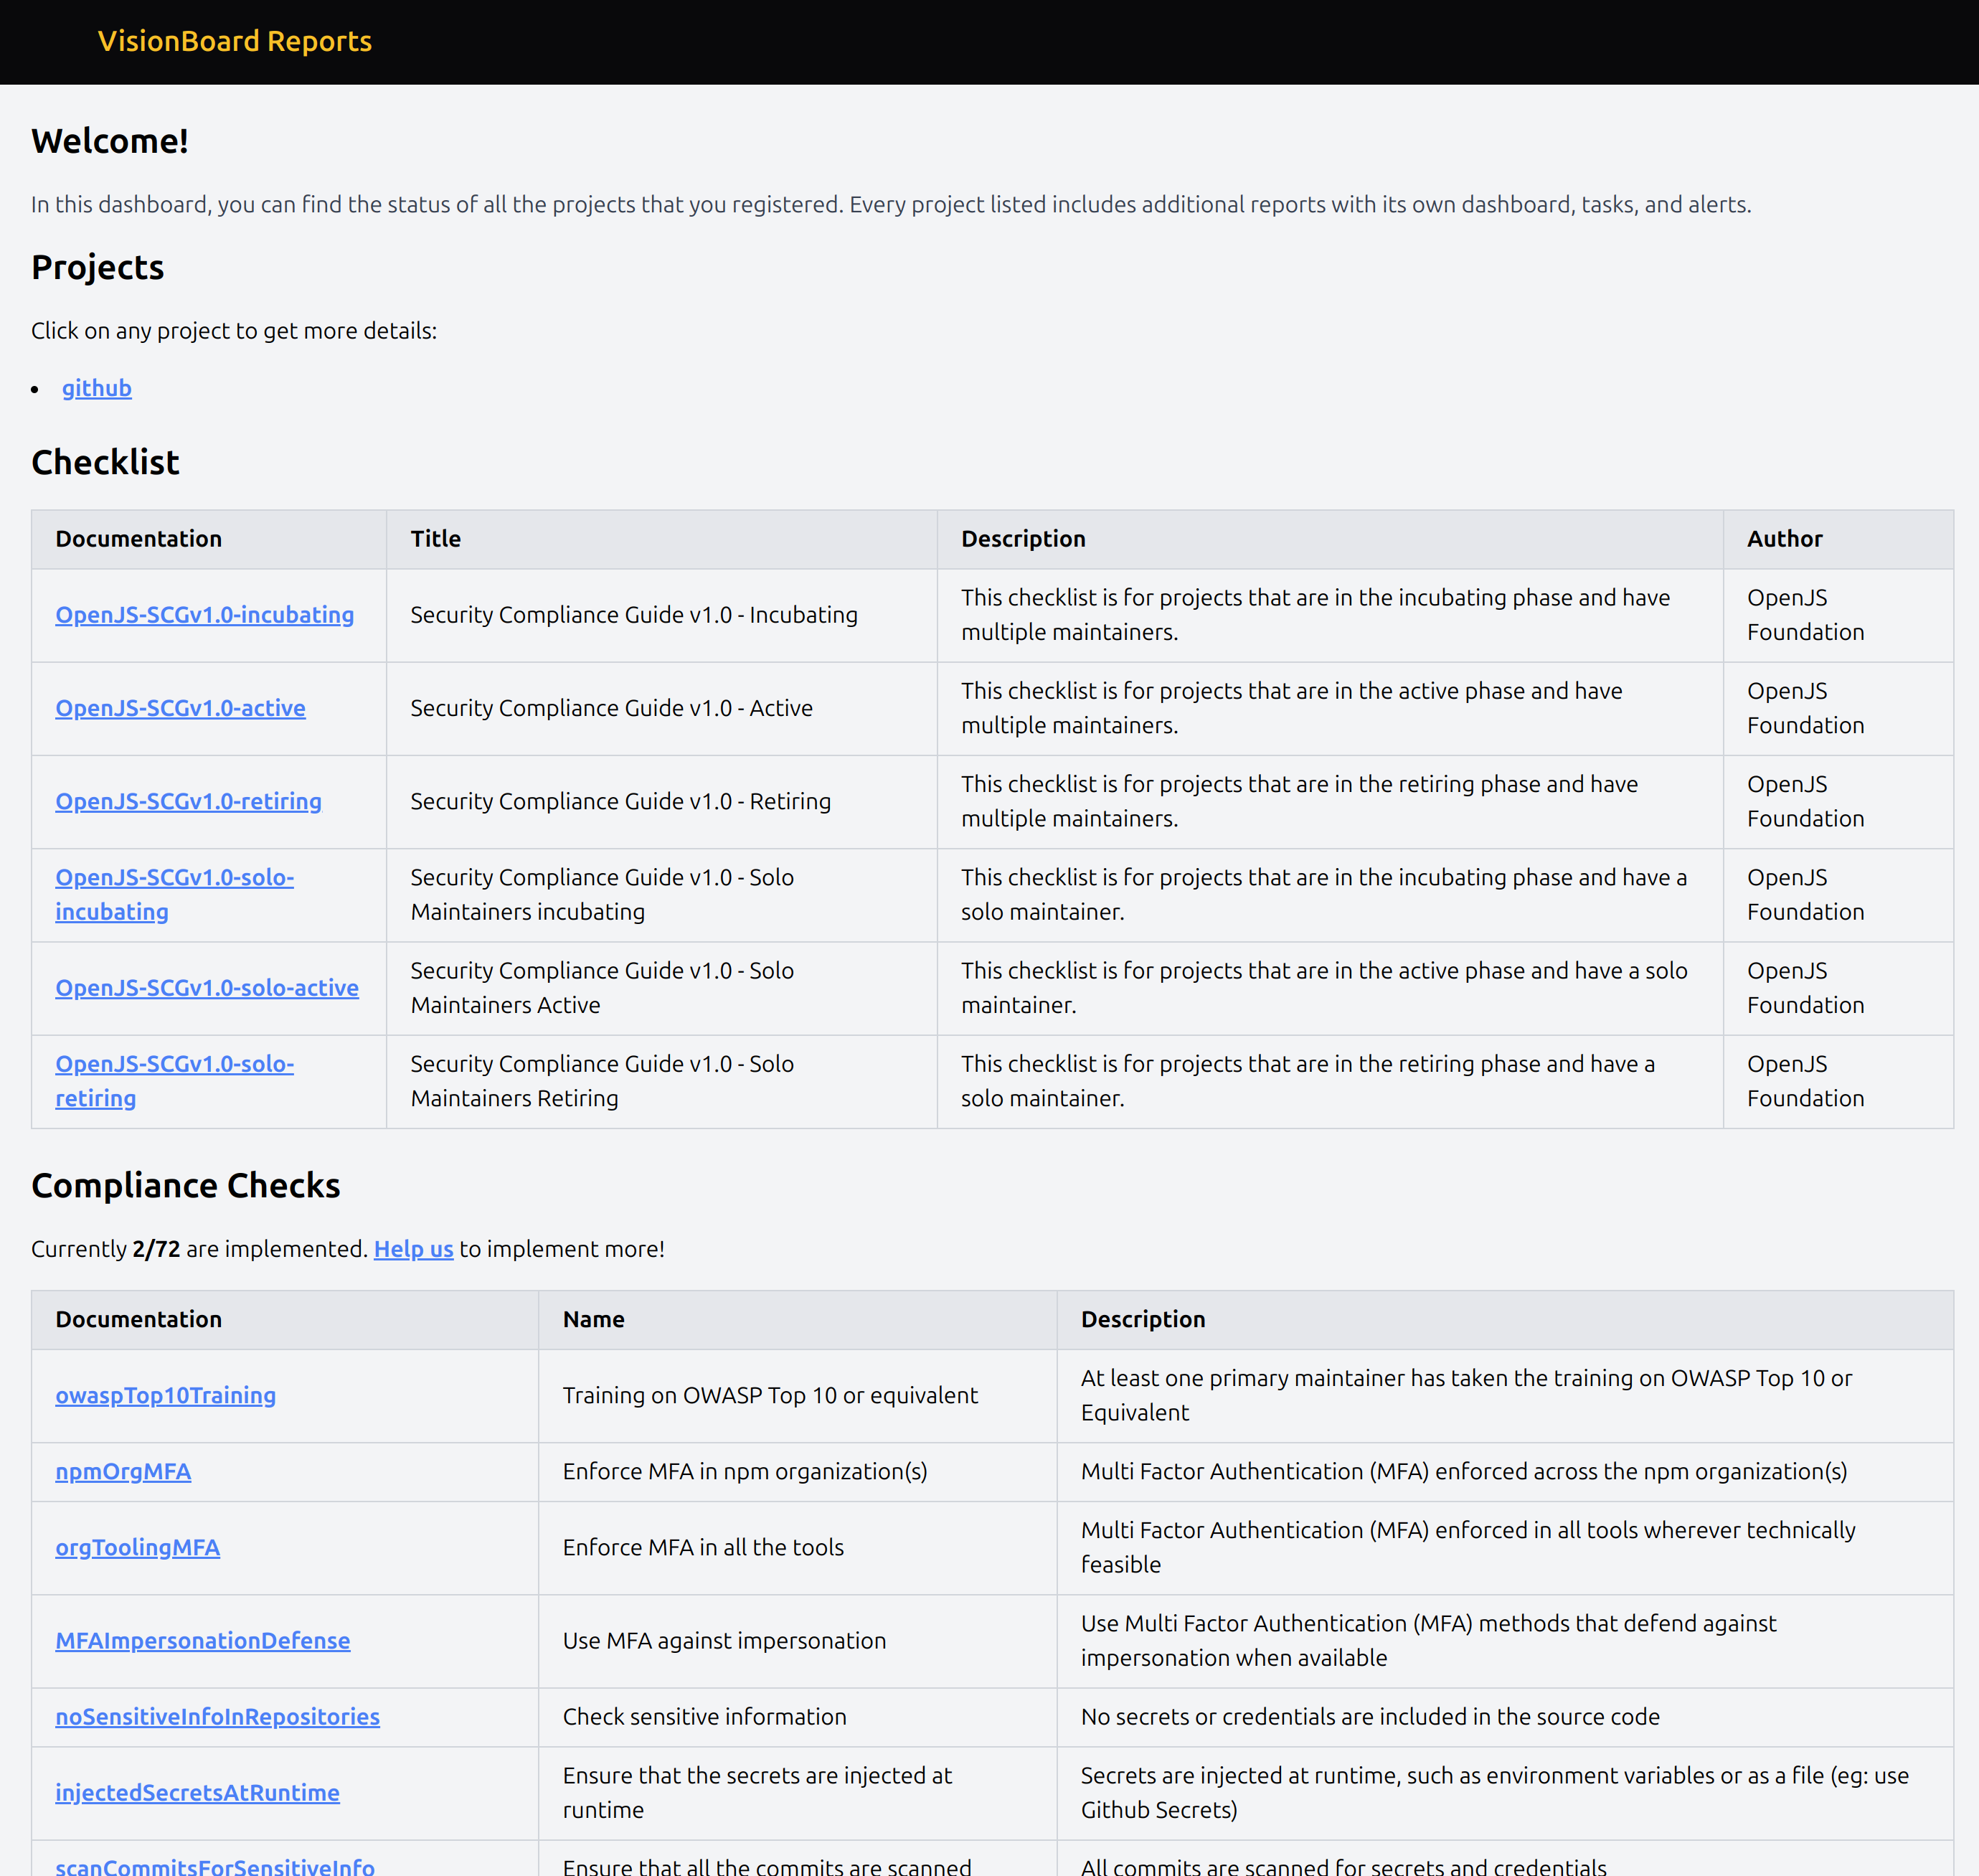
Overall shows the overall summary of reports, including a checklist for security compliance guides categorized by project phases, compliance checks, and their implementation statuses. It provides a high-level overview to help users understand their project status at a glance.
Project details
This is the details page of any project listed in the /output/projects/{name}.html file rendered in the browser.
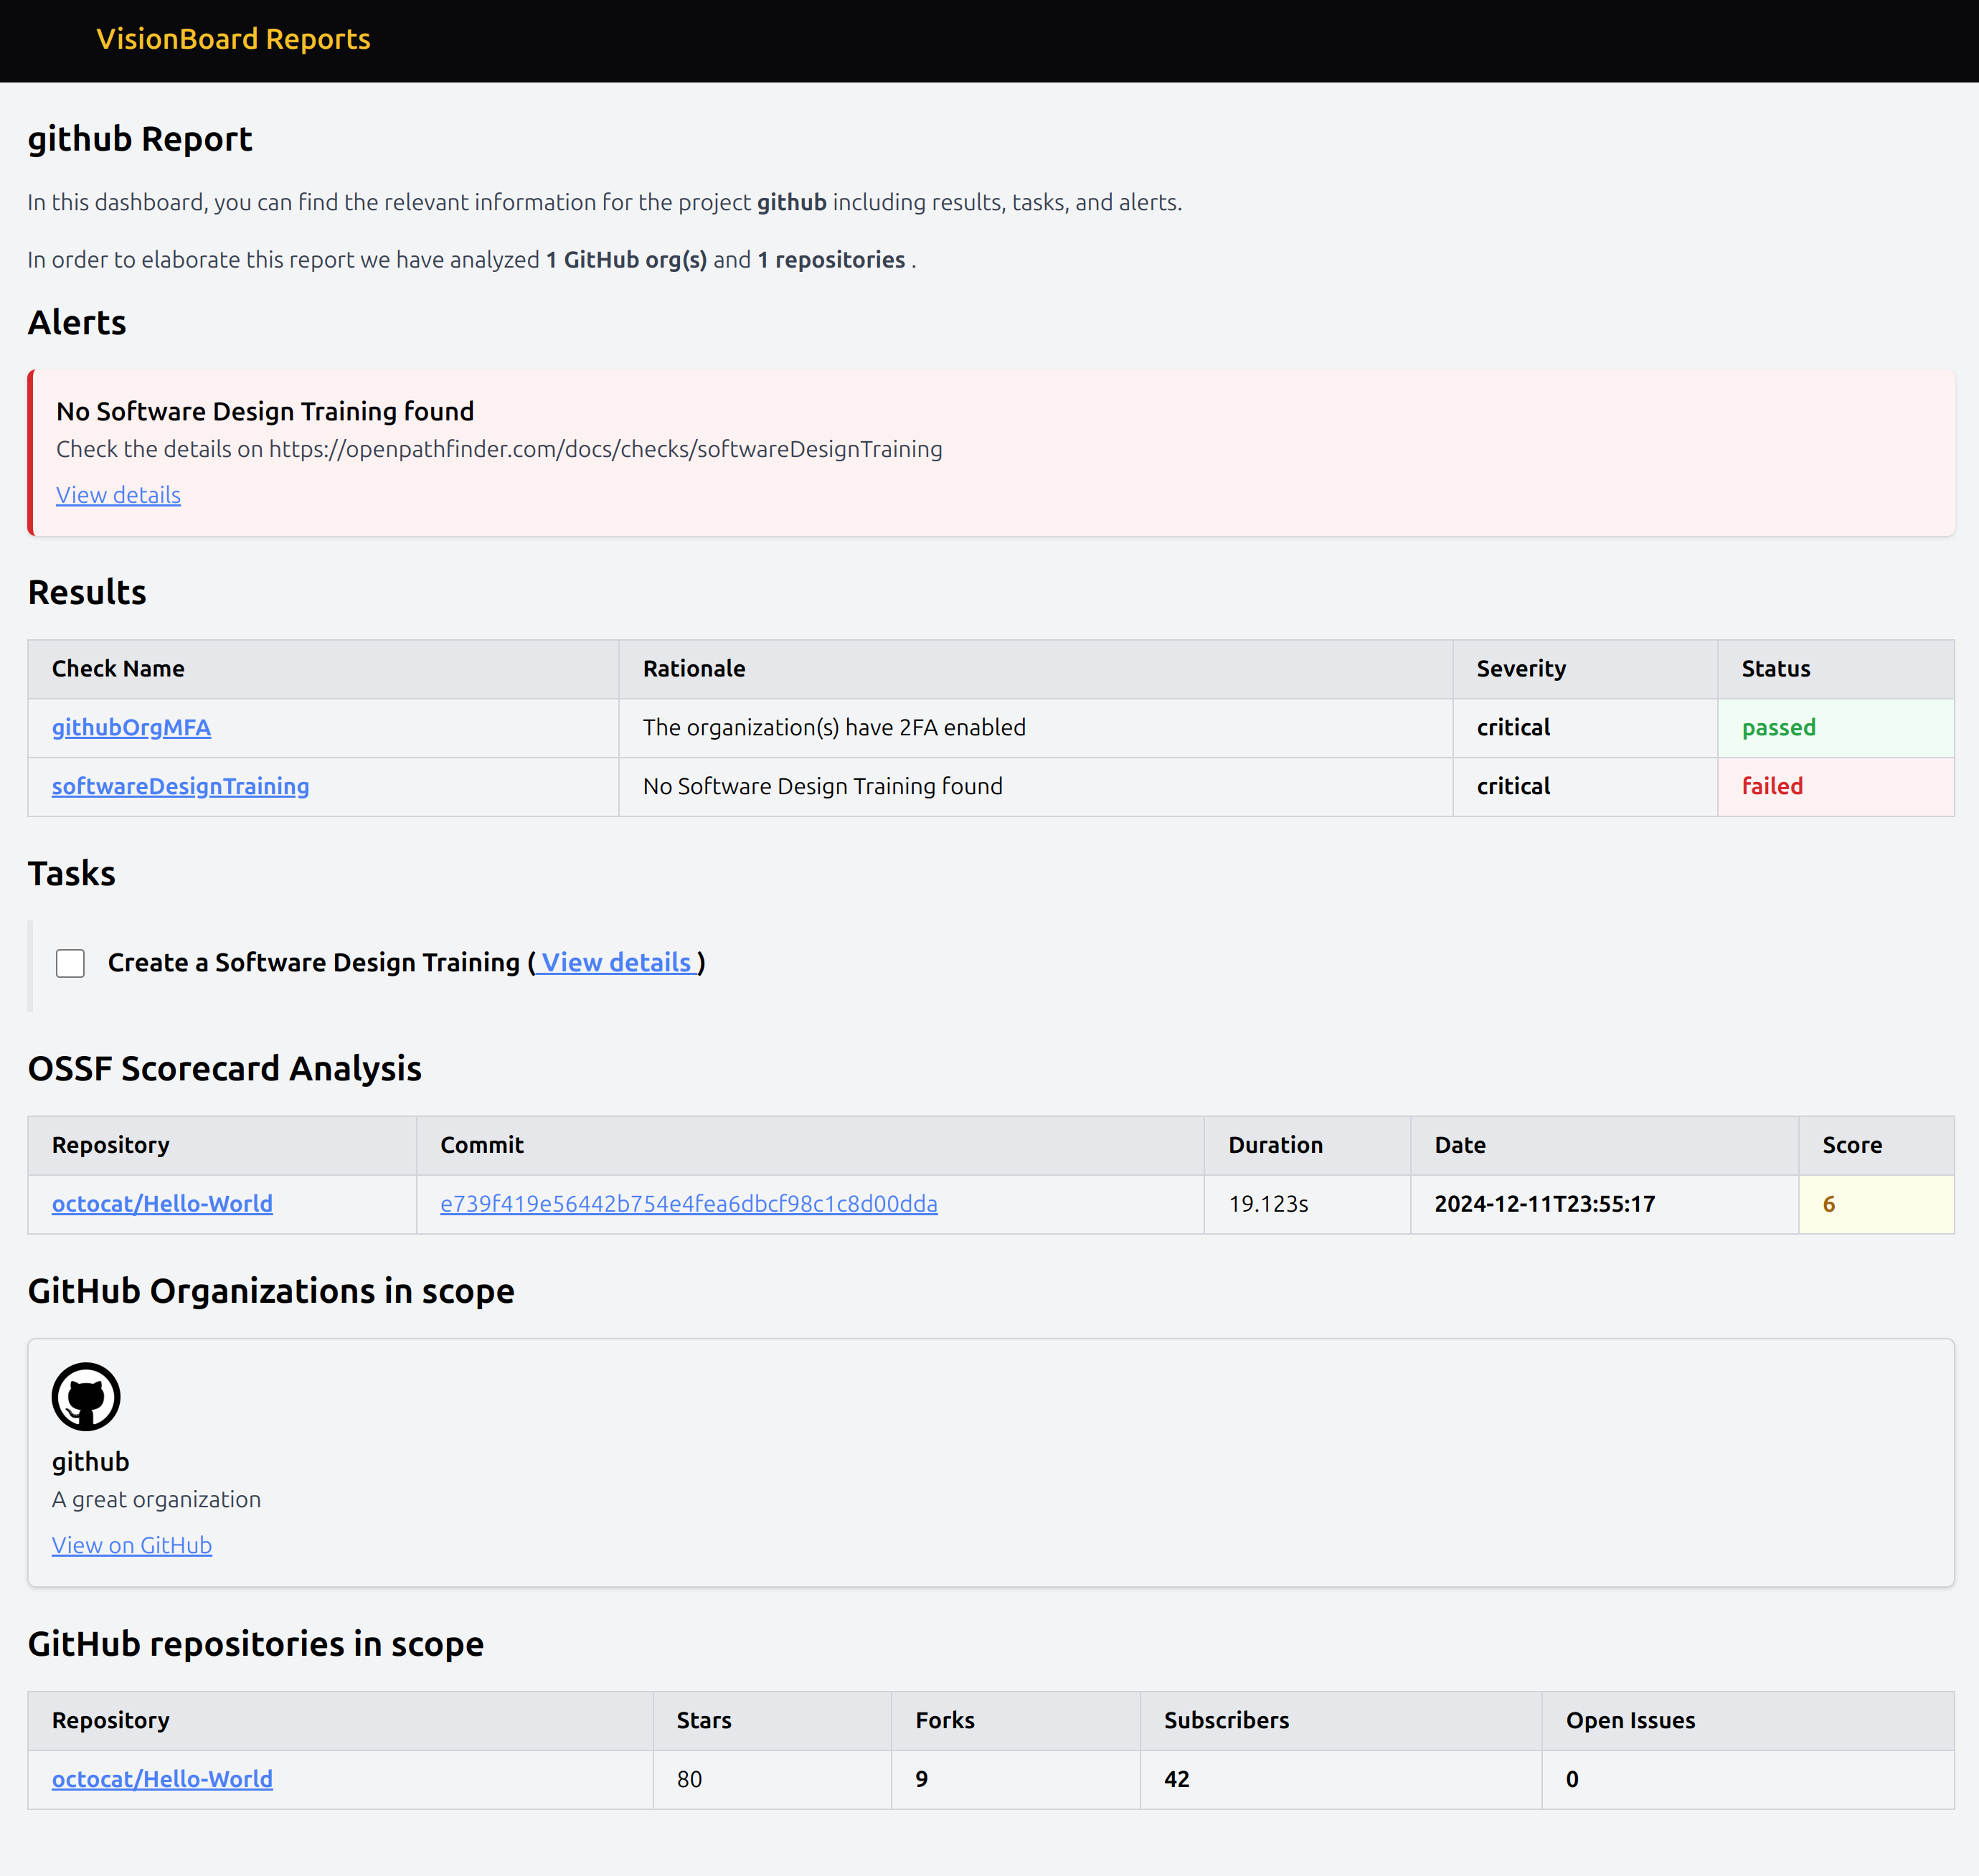
It illustrates the detailed view of an individual project's analysis. It highlights alerts, results, tasks, OSSF Scorecard Analysis, and GitHub repositories in scope, providing actionable insights and areas of improvement for a specific project.